US gun violence statistics can look very different depending on what’s being measured (firearm deaths vs. injuries; “mass shootings” vs. “active shooter” incidents). The most consistent nationwide comparisons usually start with CDC death-certificate mortality totals, then add incident-based reporting for specific event types.
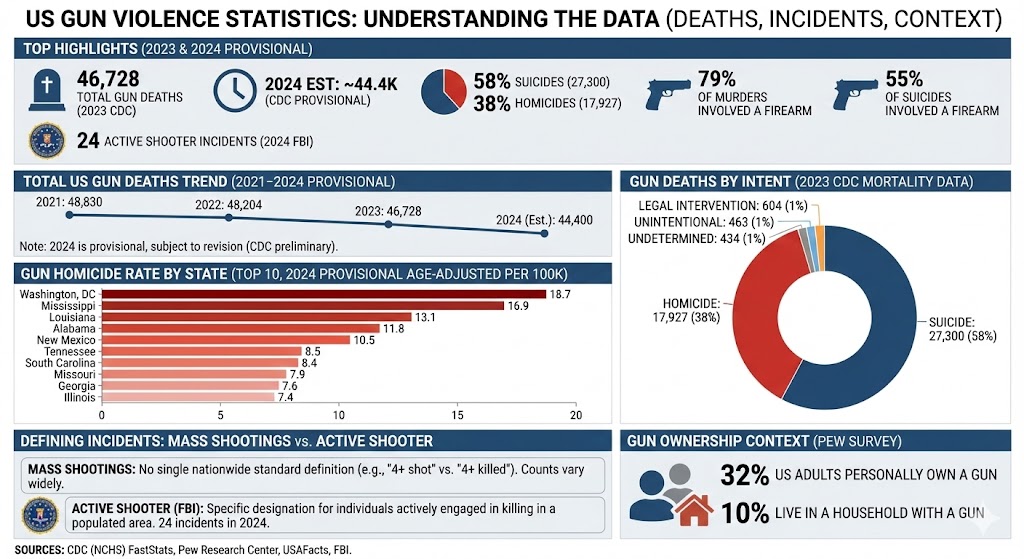
US Gun Violence Statistics (Top Highlights)
- 46,728 people died from firearm injuries in the US in 2023 (most recent year with complete CDC mortality data).
- In 2024 (provisional), an estimated 44.4K people died from gun-related injuries (CDC preliminary data summarized by USAFacts).
- In 2023, firearm deaths were primarily suicides (27,300) and murders/homicides (17,927).
- In 2023, 58% of US gun deaths were suicides and 38% were murders/homicides.
- In 2023, 79% of all murders and 55% of all suicides involved a firearm.
- In 2024, the FBI designated 24 incidents as active shooter incidents (down from 48 in 2023).
- About 32% of US adults say they personally own a gun, and another 10% say they live in a household with a gun (Pew survey).
Total US Gun Deaths (Recent Years)
2024 is provisional (subject to revision) because it comes from CDC preliminary reporting.
| Year | Gun-related deaths | Notes |
|---|---|---|
| 2021 | 48,830 | CDC mortality total (reported by Pew) |
| 2022 | 48,204 | CDC mortality total (reported by Pew) |
| 2023 | 46,728 | Most recent year with complete CDC mortality data |
| 2024 | 44,400 (est.) | Provisional estimate (CDC preliminary summary via USAFacts) |
Gun Deaths by Intent (2023)
| Label | Bar | Value |
|---|---|---|
| Suicide | 27,300 | |
| Homicide | 17,927 | |
| Legal intervention | 604 | |
| Unintentional | 463 | |
| Undetermined | 434 |
Max = 27,300. Widths: Suicide 100.00%, Homicide 65.67%, Legal intervention 2.21%, Unintentional 1.70%, Undetermined 1.59%.
Gun Homicide Rate by State (Top 10, 2024 Provisional)
These are age-adjusted firearm homicide death rates per 100,000 people (CDC preliminary reporting summarized by USAFacts).
| Label | Bar | Value |
|---|---|---|
| Washington, DC | 18.7 | |
| Mississippi | 16.9 | |
| Louisiana | 13.1 | |
| Alabama | 11.8 | |
| New Mexico | 10.5 | |
| Tennessee | 8.5 | |
| South Carolina | 8.4 | |
| Missouri | 7.9 | |
| Georgia | 7.6 | |
| Illinois | 7.4 |
Max = 18.7. Widths: Washington, DC 100.00%, Mississippi 90.37%, Louisiana 70.05%, Alabama 63.10%, New Mexico 56.15%, Tennessee 45.45%, South Carolina 44.92%, Missouri 42.25%, Georgia 40.64%, Illinois 39.57%.
Mass Shootings vs. Active Shooter Incidents
- Mass shooting counts vary widely because there is no single nationwide standard definition (for example: “4+ shot” vs. “4+ killed”; public-only vs. including domestic/gang-related incidents).
- Active shooter is a specific FBI designation; in 2024, the FBI identified 24 active shooter incidents and defines an active shooter as one or more individuals actively engaged in killing or attempting to kill people in a populated area.
Gun Ownership (Context)
Pew estimates that 32% of US adults personally own a gun and another 10% live in a household with a gun (June 2023 survey fielded by Pew).
Sources
- CDC (NCHS) FastStats: Injuries (All firearm deaths, 2023) — https://www.cdc.gov/nchs/fastats/injury.htm
- Pew Research Center (Mar 5, 2025): What the data says about gun deaths in the U.S. — https://www.pewresearch.org/short-reads/2025/03/05/what-the-data-says-about-gun-deaths-in-the-us/
- USAFacts (updated monthly): How many people die from gun-related injuries in the US each month? — https://usafacts.org/answers/how-many-people-die-from-gun-related-injuries-in-the-us-each-month/country/united-states/
- FBI (Jun 3, 2025 press release): 2024 Active Shooter Incidents in the United States report — https://www.fbi.gov/news/press-releases/fbi-releases-2024-active-shooter-incidents-in-the-united-states-report
- Pew Research Center (Jul 24, 2024): Key facts about Americans and guns — https://www.pewresearch.org/short-reads/2024/07/24/key-facts-about-americans-and-guns/
- CDC: Fast Facts: Firearm Injury and Death — https://www.cdc.gov/firearm-violence/data-research/facts-stats/index.html